发布一个使用简单的绘图工具
gochart是仿照goplot使用golang和highcharts开源库制作的一个使用起来非常简单的绘制图表的工具,图表风格有曲线图、折线图、面积图、柱状图、饼图等。编译好的gochart只有一个二进制文件,不依赖任何库/网络。
直接下载二进制
从源码安装
直接只用命令go get -u github.com/zieckey/gochart即可。该命令会自动处理好依赖的开源项目:
使用方法
- 解压下载包后,进入解压目录,可以看到一个gochart的可执行文件和一些*.chart文件,这些chart文件是默认的一些数据文件样例。可以在这些chart文件的目录执行gochart,然后通过浏览器访问http://localhost:8000就可以看到图表了。
- 可以把
gochart工具放到您的PATH中,在*.chart文件所在的目录执行gochart即可。 - chart文件必须是.chart后缀名,内容可以参考源码examples目录中的例子。启动gochart的目录如果有多个chart文件,可以通过不断刷新网页来切换图表。
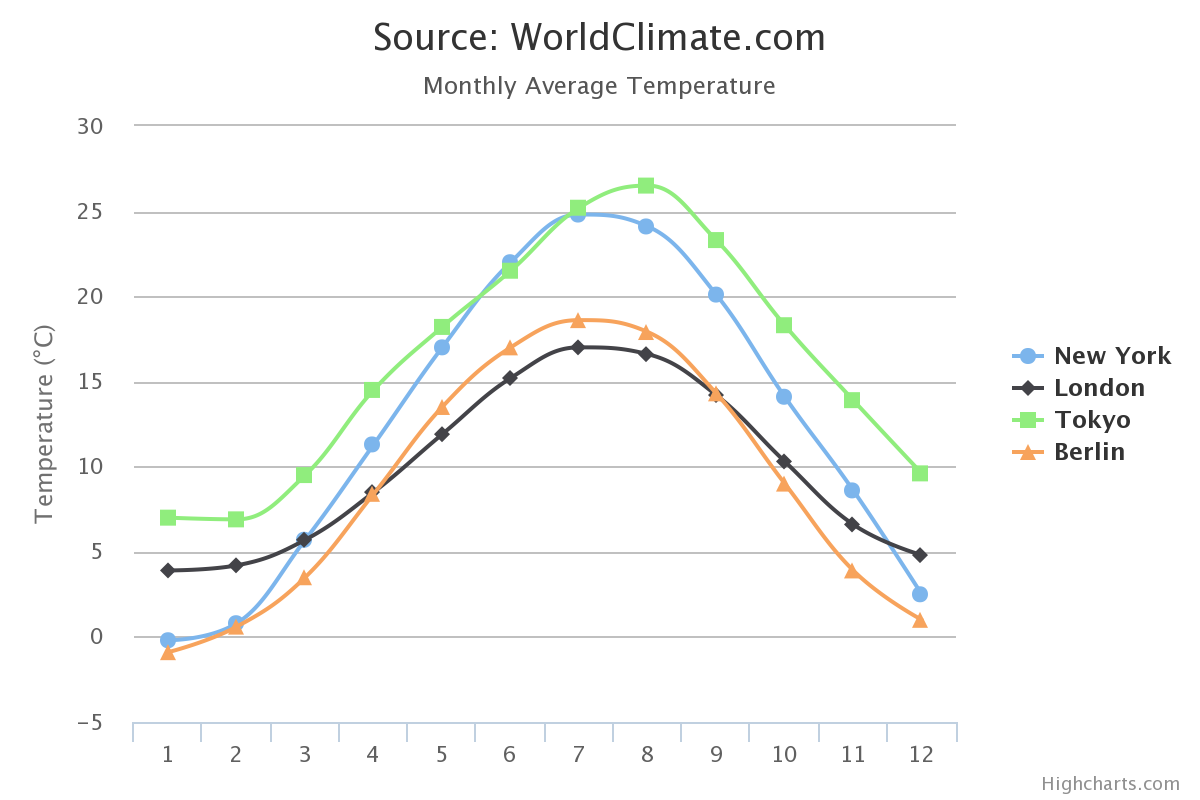
示例2:曲线图数据格式样例
该示例数据格式与曲线图、折线图、面积图、(横向/纵向)柱状图通用。通过改变ChartType可以展现不同类型的图,如下:
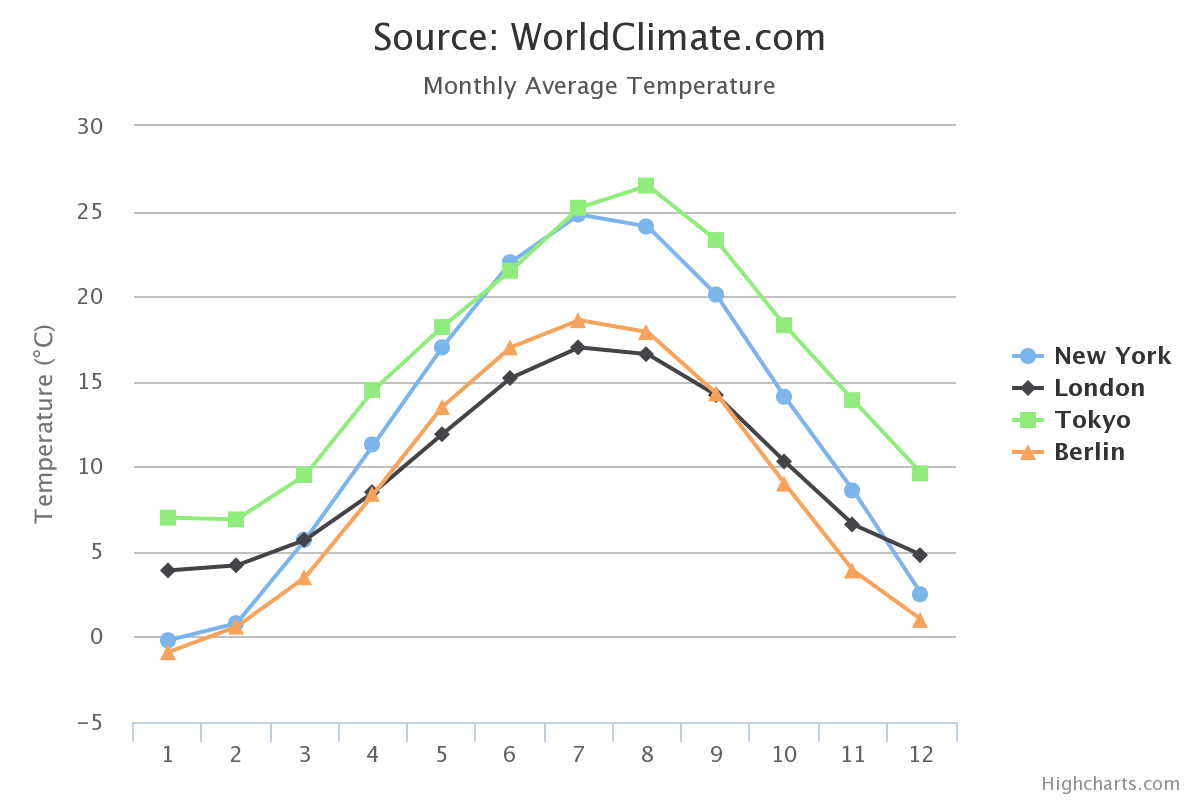
- spline 曲线图
- line 折线图
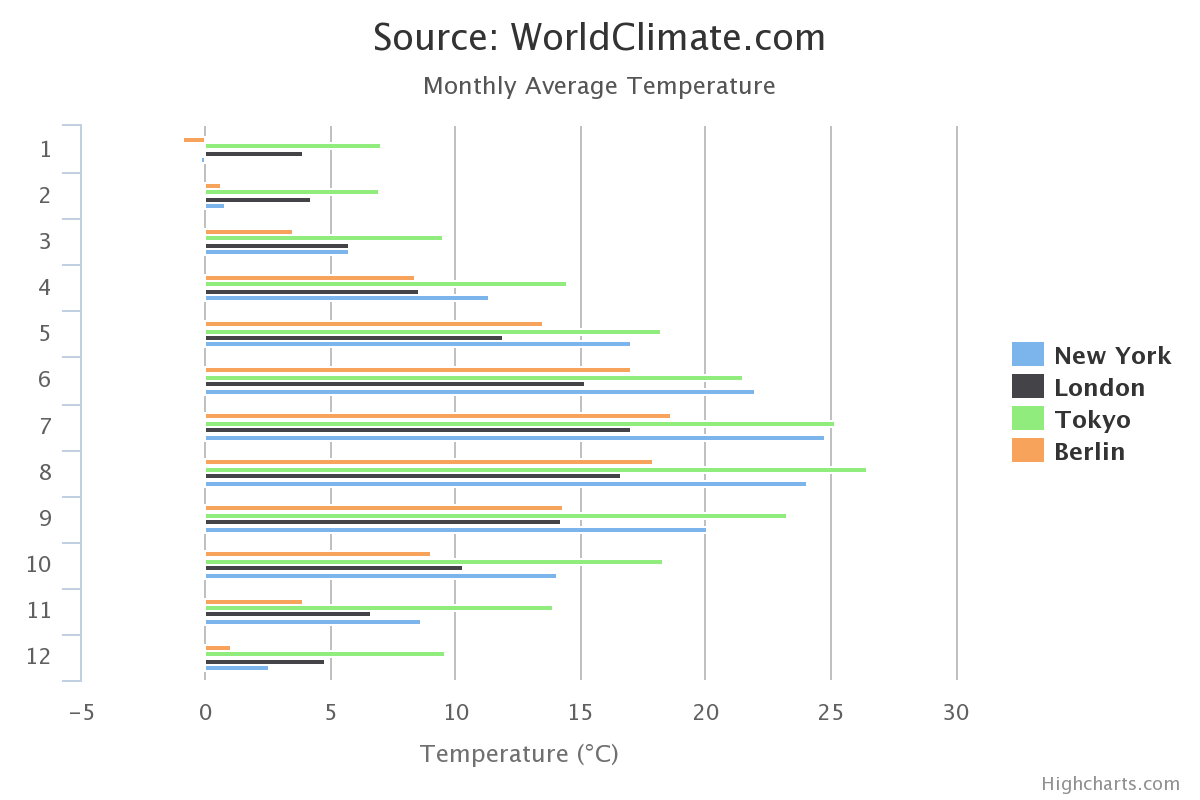
- bar 横向柱状图
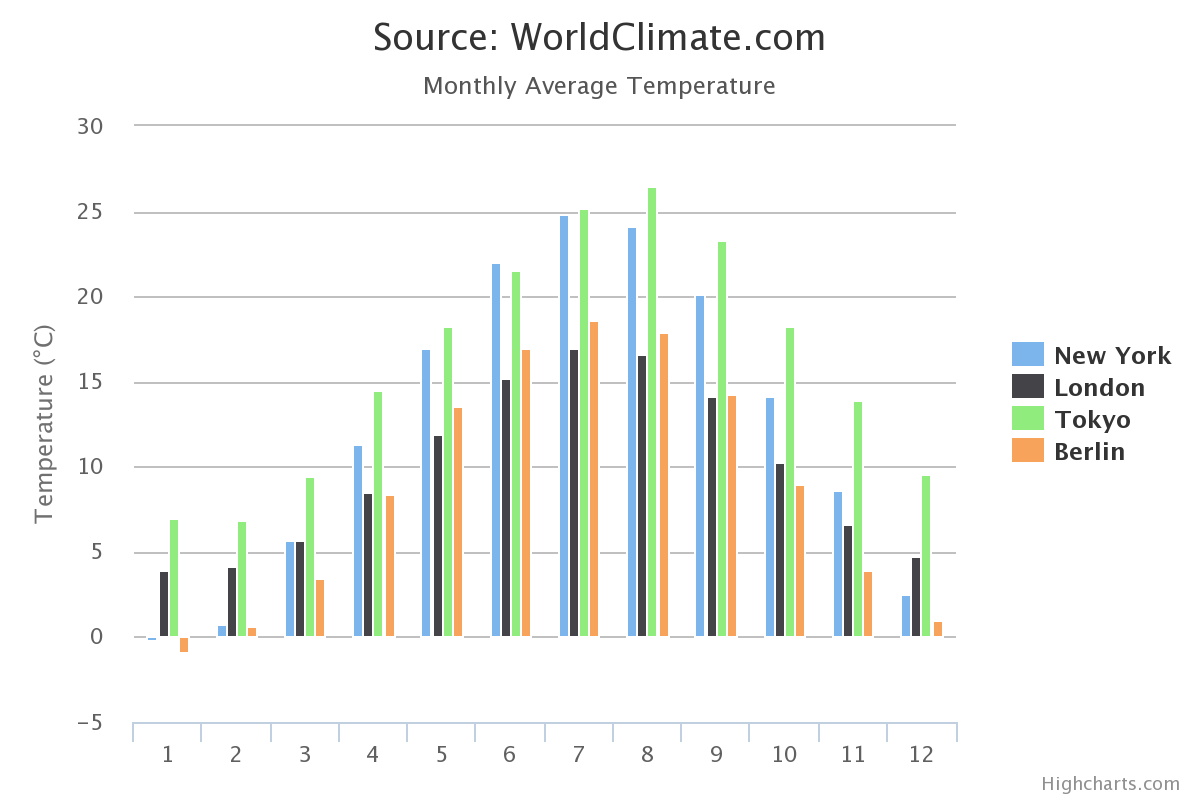
- column 纵向柱状图
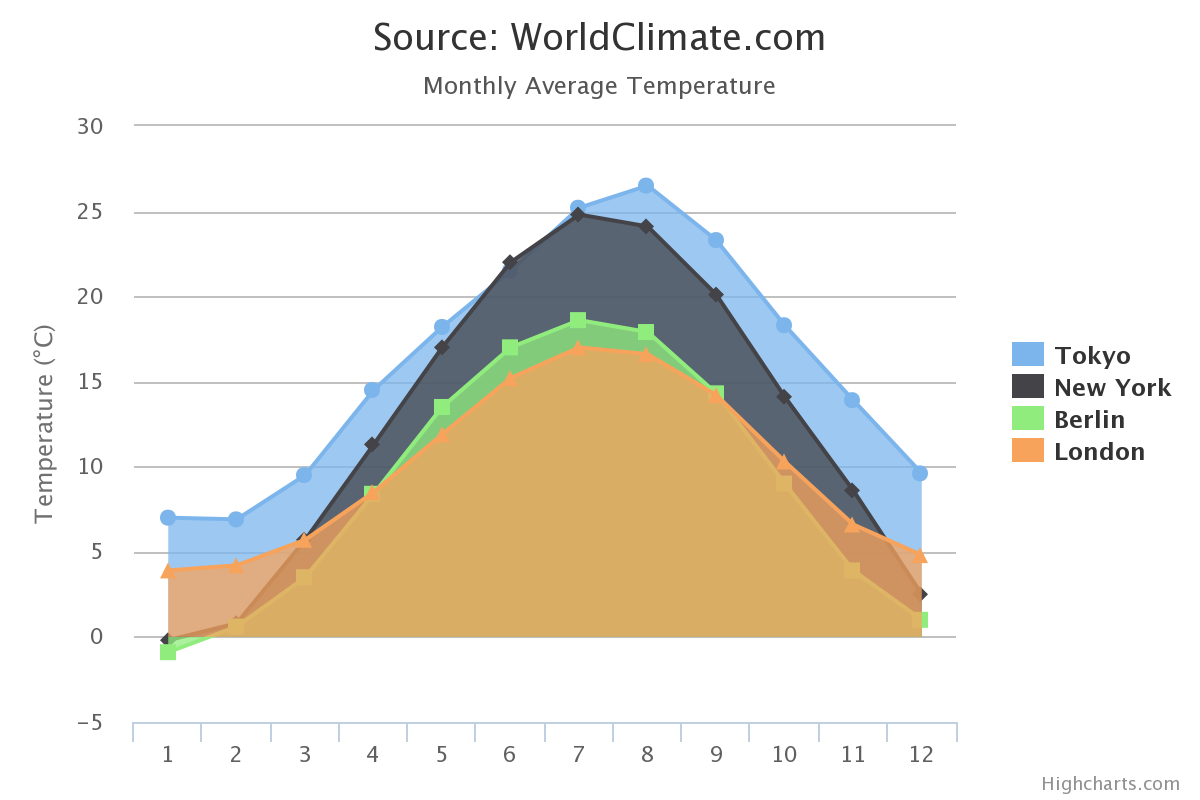
- area 面积图
# The chart type , option : spline/line/bar/column/area
ChartType = spline
Title = Source: WorldClimate.com
SubTitle = Monthly Average Temperature
ValueSuffix = °C

# The x Axis numbers. The count this numbers MUST be the same with the data series
XAxisNumbers = 1, 2, 3, 4, 5, 6, 7, 8, 9, 10, 11, 12

# The y Axis text
YAxisText = Temperature (°C)

# The data and the name of the lines
Data|Tokyo = 7.0, 6.9, 9.5, 14.5, 18.2, 21.5, 25.2, 26.5, 23.3, 18.3, 13.9, 9.6
Data|New York = -0.2, 0.8, 5.7, 11.3, 17.0, 22.0, 24.8, 24.1, 20.1, 14.1, 8.6, 2.5
Data|Berlin = -0.9, 0.6, 3.5, 8.4, 13.5, 17.0, 18.6, 17.9, 14.3, 9.0, 3.9, 1.0
Data|London = 3.9, 4.2, 5.7, 8.5, 11.9, 15.2, 17.0, 16.6, 14.2, 10.3, 6.6, 4.8
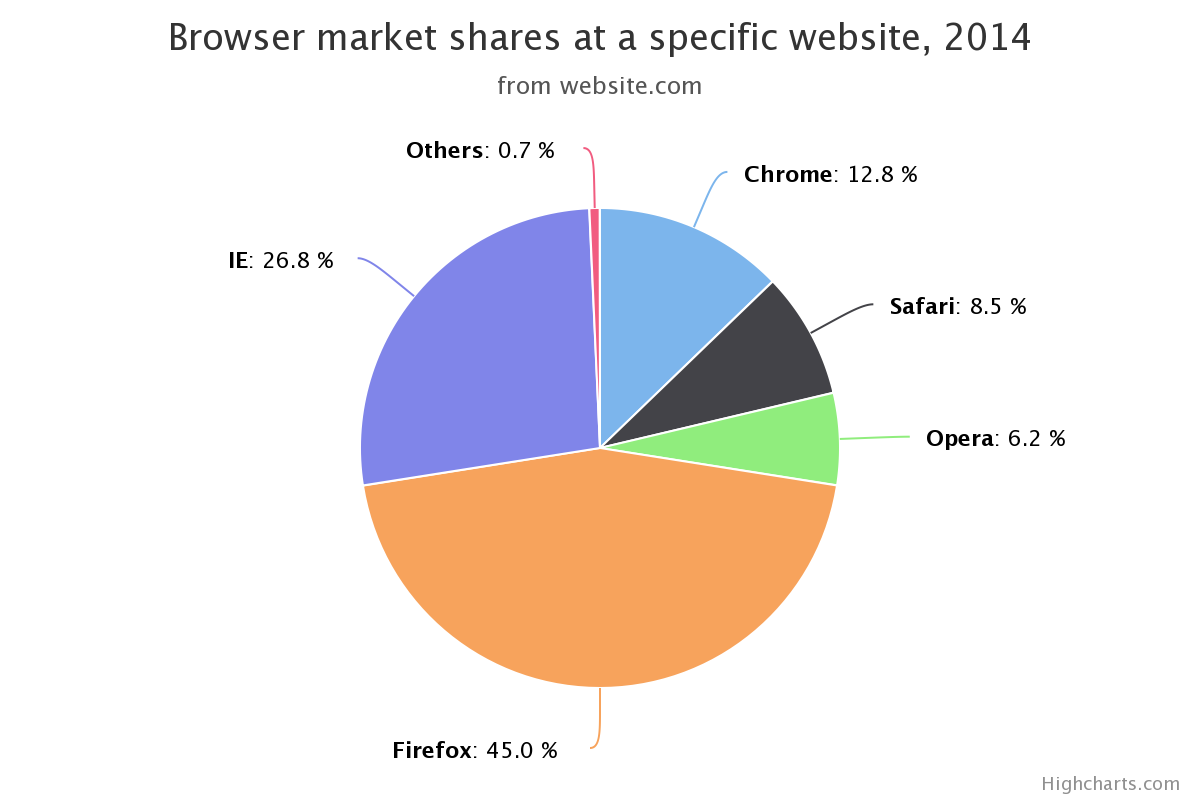
示例2:饼图数据格式样例
该示例数据格式展示了如何绘制一个饼图。
ChartType  = pie
Title 	   = Browser market shares at a specific website, 2014
SubTitle   = from website.com
SeriesName = Browser shares

# The data and the name of the pieces of the pie
Data|Firefox = 45.0
Data|IE 	 = 26.8
Data|Chrome  = 12.8
Data|Safari  = 8.5
Data|Opera   = 6.2
Data|Others  = 0.7
曲线图
饼图
纵向柱状图
面积图
折线图
横向柱状图